An Approach to Marking Handwritten Concept Maps
About this resource
By Abhirami Senthilkumaran, Honorary Research Associate, UBC Faculty of Forestry, and Fernanda Tomaselli, Assistant Professor of Teaching and Coordinator, Land One program, UBC
For our BCcampus Research Fellows project, we are examining the outcomes of using a co-operative board game in an undergraduate climate change class. One of the data collection materials we used to evaluate student understanding was concept maps. We sought to evaluate how their understanding of the key concepts and connections related to climate change across the categories of mitigation, adaptation, impact, and causes, changed after the instructional activity (i.e., playing a co-operative board game).
Students were divided into two groups: one group played a co-operative board game related to climate change and the other group played a co-operative board game unrelated to climate change. All participants were provided with the following instructions and handout (Figure 1) prior to and after the instructional activity. They were given ten minutes to complete the concept map. All submissions were annotated with a five digit unique code to compare pre-test and post-test responses. Students submitted hard copy responses, as well as photographed and uploaded an image of their responses to the online questionnaire.
Student Instructions
In this section we are interested in learning about your understanding of climate change. Please complete the steps listed below. (We are not looking for a specific correct answer.)
In about 2 minutes, for each of the following categories related to climate change, list as many keywords as you can think of: CAUSES, MITIGATION, IMPACT, ADAPTATION.
Take 5 minutes and draw a concept map of climate change that incorporates the keywords from your list.
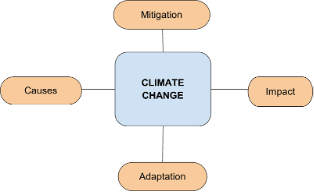
In the next 3 minutes, label the arrows with verbs (e.g., “leads to”, “increases”) when possible and include any feedback loops or interactions you are aware of. Use icons or visuals to aid comprehension. You may use a digital drawing platform or the paper provided. If you used a digital drawing app, please save your image in .jpg or .png format. If you used the paper provided, please take a photo of your work with your phone.
Fig 1: Handout provided to students as a starting point for their concept-mapping activity.
Studies that use concept maps often involve concept-mapping software (Eggert et al., 2017), which requires 45-60 minutes of onboarding. Given the cognitive challenges of learning and playing a new board game, we decided to take the handwritten route for our concept maps. This allowed students to focus on the content in their concept maps without worrying about the tools and procedures of creating one.
We reviewed the literature on assessing concept maps and identified the following evaluation metrics (Watson et al., 2016):
Traditional: each concept map is assigned a separate score for knowledge breadth, knowledge depth, and knowledge connectedness.
Holistic: each concept map is assigned an overall score based on its comprehensiveness (knowledge breadth and depth), organization, and correctness.
Categorical: For each top-level category in the concept map, a category score and a complexity index are computed. The category score captures the number of concepts in that category and the complexity index is a measure of the degree of interconnectedness of concepts in that category with concepts in other categories. Categories may be predetermined (e.g., the sub-headings in our template handout) or generated from themes that emerge in the concept maps.
For our evaluation, we used a combination of traditional and categorical scoring. For each concept map, we recorded the number of concepts under each top-level category, and the number of connections from a concept in that category to a concept in any other category. We felt that a mere count of the number of concepts and connections did not capture the quality of ideas and relationships in the concept map. So, we also included a systems thinking sophistication score between 0 and 3 in 0.5 level increments to indicate the level of systems thinking sophistication demonstrated by each concept map. Our rubric was adapted from Gray et al. (2019) and expectations were adjusted to account for the fact that the students only had ten minutes to complete this task.
Each concept map was scored by two (out of three) members of the research team. When our scores differed by more than one point for the category and complexity scores or by more than half a point for the sophistication score, we discussed our rationale to arrive at a corrected score that was agreed upon by both researchers. This evaluation was done without knowledge of which experimental group the student whose concept map we were marking was assigned to. We were subsequently able to compare changes from the pre-test to the post-test, as well as scores between the two groups in the experiment.
Lessons Learned
The choice to not use a concept-mapping software tool was prudent from a student point of view. We were able to collect data in 10-15 minutes that would have otherwise required up to an hour of preparation and training time for each student. From the researchers’ point of view, however, it increased our marking time significantly. It was fairly straightforward to count the number of concepts and connections under each category, but many micro- decisions related to punctuation choices needed to be made for consistent scoring (e.g., Do concepts under the same hierarchy separated by commas or forward-slashes count as a single concept or multiple ones?; Do concepts connected by an “and” conjunction count as one or two concepts?; Should two-sided arrows count as a connection under both categories that they are drawn under or scored as half a point in each category?). On the other hand, the sophistication score had the least consistency across raters. We had to schedule multiple practice scoring sessions to align on a rubric that we agreed upon and record reference examples for each score level.
We randomly divided the total maps to be scored among the three of us with one researcher scoring all of them, one researcher scoring all pre-tests, and the third researcher scoring all post-tests. In retrospect, it may have helped to have the second and third researchers split the concept maps so that the same person marked both the pre-test and post-test for a given student. Doing so would have eliminated the bias introduced by the pre-test or post-test scorer being more lenient in interpreting the rubric compared to the other scorer, with the researchers still blind to which experimental group’s concept maps they were marking.
In addition to concept map evaluation, we also performed a text frequency comparison on the list of keywords submitted. Word clouds from this analysis revealed interesting shifts in themes within and across categories. Stay tuned for a report on those findings.
We would like to thank Sadie Russell, Graduate Academic Assistant, UBC Faculty of Forestry for her excellent work conducting the gameplay sessions, supervising data collection and scoring all the concept maps.
References
Eggert, S., Nitsch, A., Boone, W. J., Nückles, M., & Bögeholz, S. (2017). Supporting students’ learning and socioscientific reasoning about climate change—The effect of computer-based concept mapping scaffolds. Research in Science Education, 47, 137-159.
Gray, S., Sterling, E. J., Aminpour, P., Goralnik, L., Singer, A., Wei, C., … & Norris, P. (2019). Assessing (social-ecological) systems thinking by evaluating cognitive maps. Sustainability, 11(20), 5753.
Watson, M. K., Pelkey, J., Noyes, C. R., & Rodgers, M. O. (2016). Assessing conceptual knowledge using three concept map scoring methods. Journal of engineering education, 105(1), 118-146.
- Published
- June 3, 2025
- Topics
- Teaching OnlineEdTech
Frequently Asked Questions
How do I use OER from this collection?
1. Search the collection.
Find matching OER based on subject area, course level, institution course codes (e.g., UBC MATH 101), or keywords. The collection has highly curated materials, so if you don’t find what you are looking for, you can search other OER repositories such as OASIS, which will return many resources not reviewed by BCcampus.
2. Evaluate.
Decide whether the materials will suit your needs as they are, or if they could be customized to fit your course. Some features that may help you narrow down your search are seeing if the resource has supplementary teaching materials, is accessible, is for the right level, or has been tried and tested by peers in the field.
3. Customize.
You may find you want to customize the materials for your course. Download the editable formats to make changes according to the license. For more information on how to customize or adapt open educational resources (OER) see the BCcampus Adaptation Guide.
4. Distribute to your students.
You can download the resource in the different available formats and share using your favourite platforms, including a learning management system or file-sharing service like Dropbox or Google Drive.
5. Inform us.
Fill out the Open Textbook Adoption Form or Open Course Materials Adoption Form so we can help others see that colleagues are adopting OERs.
Do I need permission to use materials from this collection?
What can I do with materials under open or Creative Commons licenses?
An open license, or open-copyright license, grants permission to access, retain, reuse, redistribute, and build on (remix and revise) a work with few or no restrictions.
The terms of open or Creative Commons licenses vary; however, all Creative Commons licences contain an attribution (BY) clause. This means you must include a statement that gives credit to, or attributes, the creator of the work from which you have borrowed, whether it’s text, image, video, or another item. If you have made a change, indicate that in your attribution statement.
For more information, see “Attribution Statement” in the Adaptation Guide.
How do I customize materials from the collection?
You may find you want to customize the materials for your course. Because all of the materials in this collection are openly licensed, you are free to adapt and reuse them. Open licences are how copyright holders let the world know that they are okay with people taking, reusing, and adapting their creative works.
To adapt the materials in this collection, download the editable formats to make changes according to the license.
See the sections on Licences and Permissions in the Getting Started: OER Publishing at BCcampus guide for more information.
Once changes are made, ensure that you:
- Follow the license requirements, such as giving credit to the original creator
- Keep track of the changes that were made
For more information on how to customize or adapt open educational resources (OER) see the BCcampus Adaptation Guide.
How do I report an issue with materials?
If you encounter an error or inappropriate content on the site or in any of the course materials, please contact us so the issue can be resolved.
What's the best way to find course packs for my course?
If you are teaching a course at a B.C. institution, the easiest way to see if there is a course pack for your course (or transferable equivalent) is to search by course code. For example, typing TRU ECON 2320 will show you Business Statistics, which was designed for MATH 125 at Coast Mountain College.